
The workload analysis report allows you to check the workload distribution based on the available capacity.
The user can view the overall quality of the workload analysis, or explore it in detail, optimizing the distribution manually or automatically.
Before you start
View Workload Analysis result
-
In the FSM App, navigate to FEATURES → FORECASTING & CAPACITY PLANNING → WORKLOAD ANALYSIS
-
Use the filter panel to search for existing analyses
-
Click the “Workload analysis result” button in the menu button of a selected record in “Processed: OK” status.
A new page will be opened showing analysis' result.
The system will show the percentage amount of hours in terms of work orders and work shifts for each period.
|
|
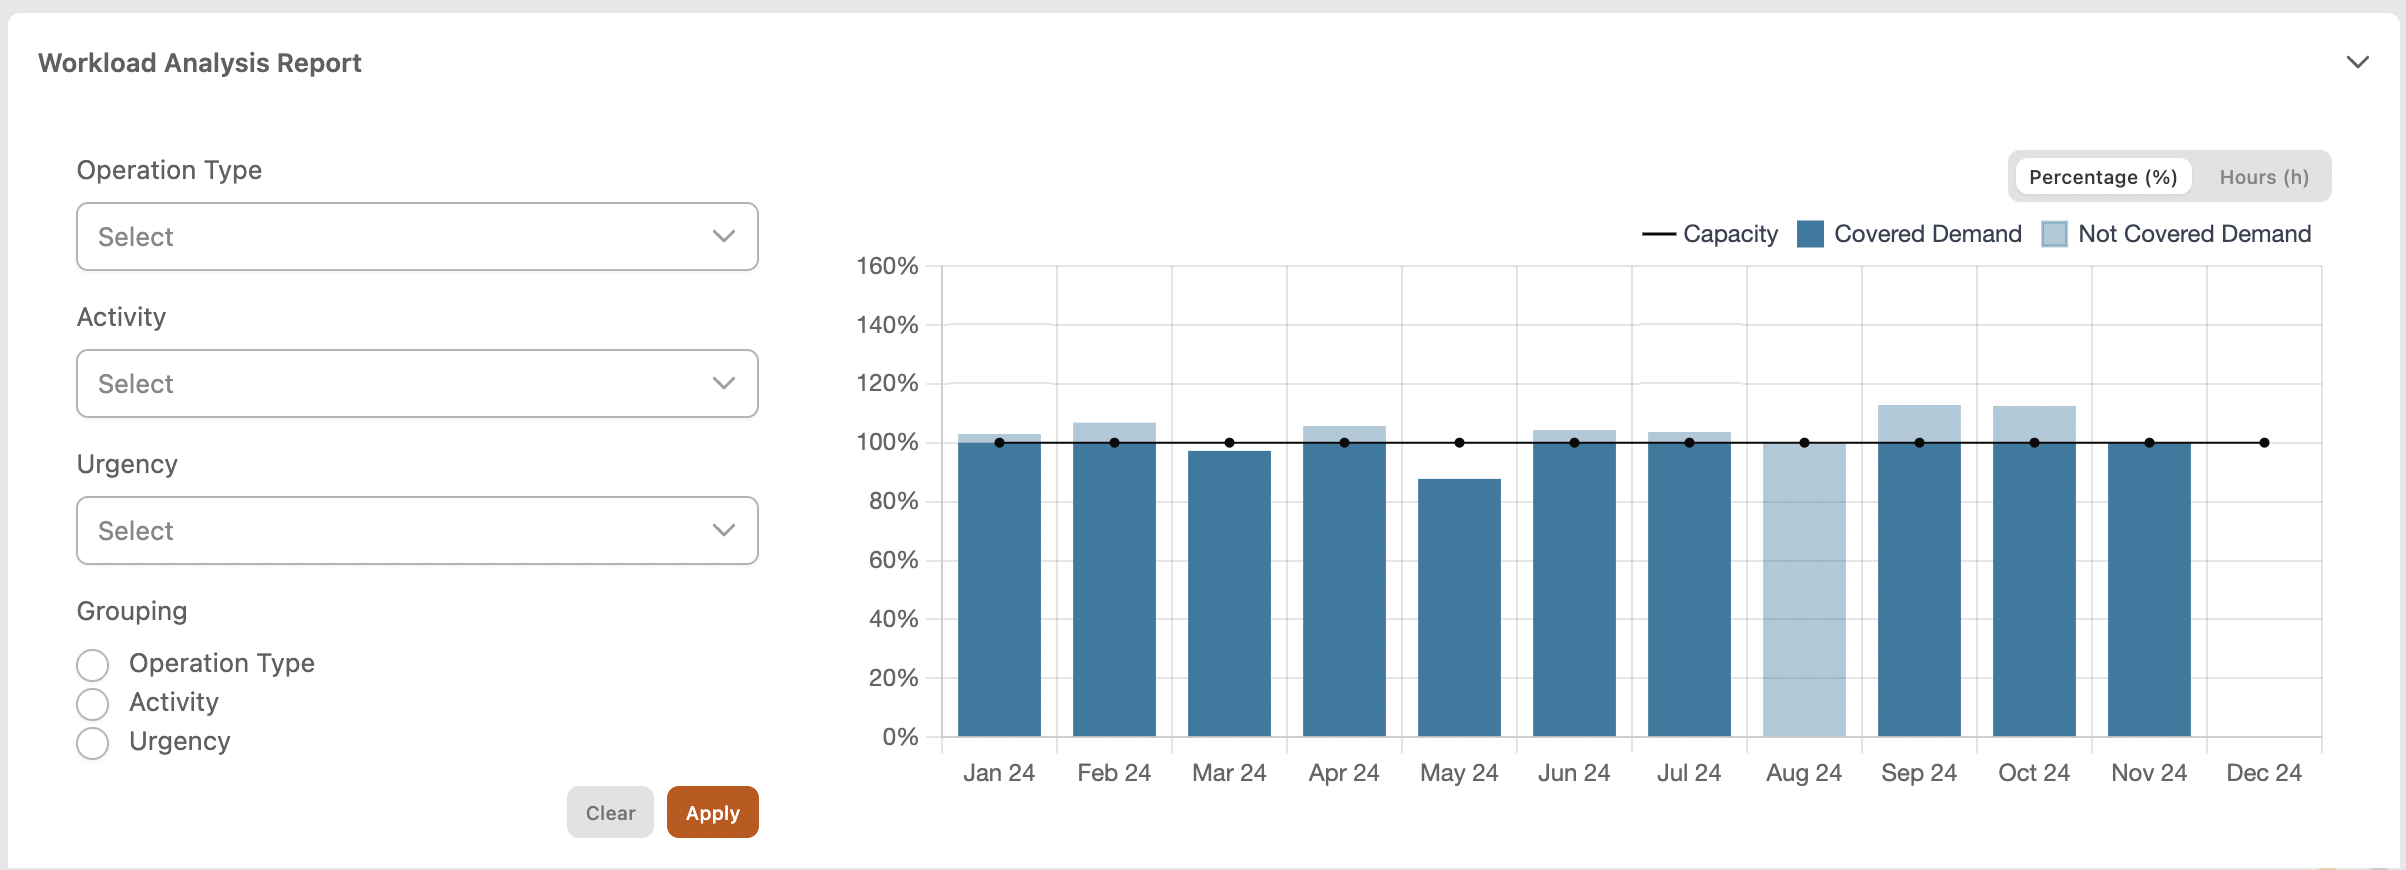
Figure 1 - Workload Analysis result |
This report shows for each month the amount of demand and capacity.
The y-axis represents the % of demand related to the capacity’s value.
The x-axis is the time and it depends by the grouping field. It can be grouped also by operation type, activity and urgency.
Going on each bar you can see a tooltip with the total number of hours.
The plot is also available in hours clicking on the “Hours” button at the top-right of the report.
Capacity
-
The black line is the capacity and represents the 100%.
Demand
-
The dark-blue bar is the covered demand, that is the percentage value of total assigned demand.
-
The light-blue bar is the not covered demand, that is the percentage value of total not assigned demand. This data means that there aren’t enough resources to execute activities.
The plot can be filtered by Operation Type, Activity and Urgency (multi-select).
The grouping field allow to group by operation type, activity and urgency.
Table report
Clicking on each bar of the bar chart a table at the bottom of the page will show data related to the selected period.
The table can be filtered by date, activity, operation type and urgency (multi-select).
The grouping field allows to group table’s data by activity, operation type and urgency.
|
|
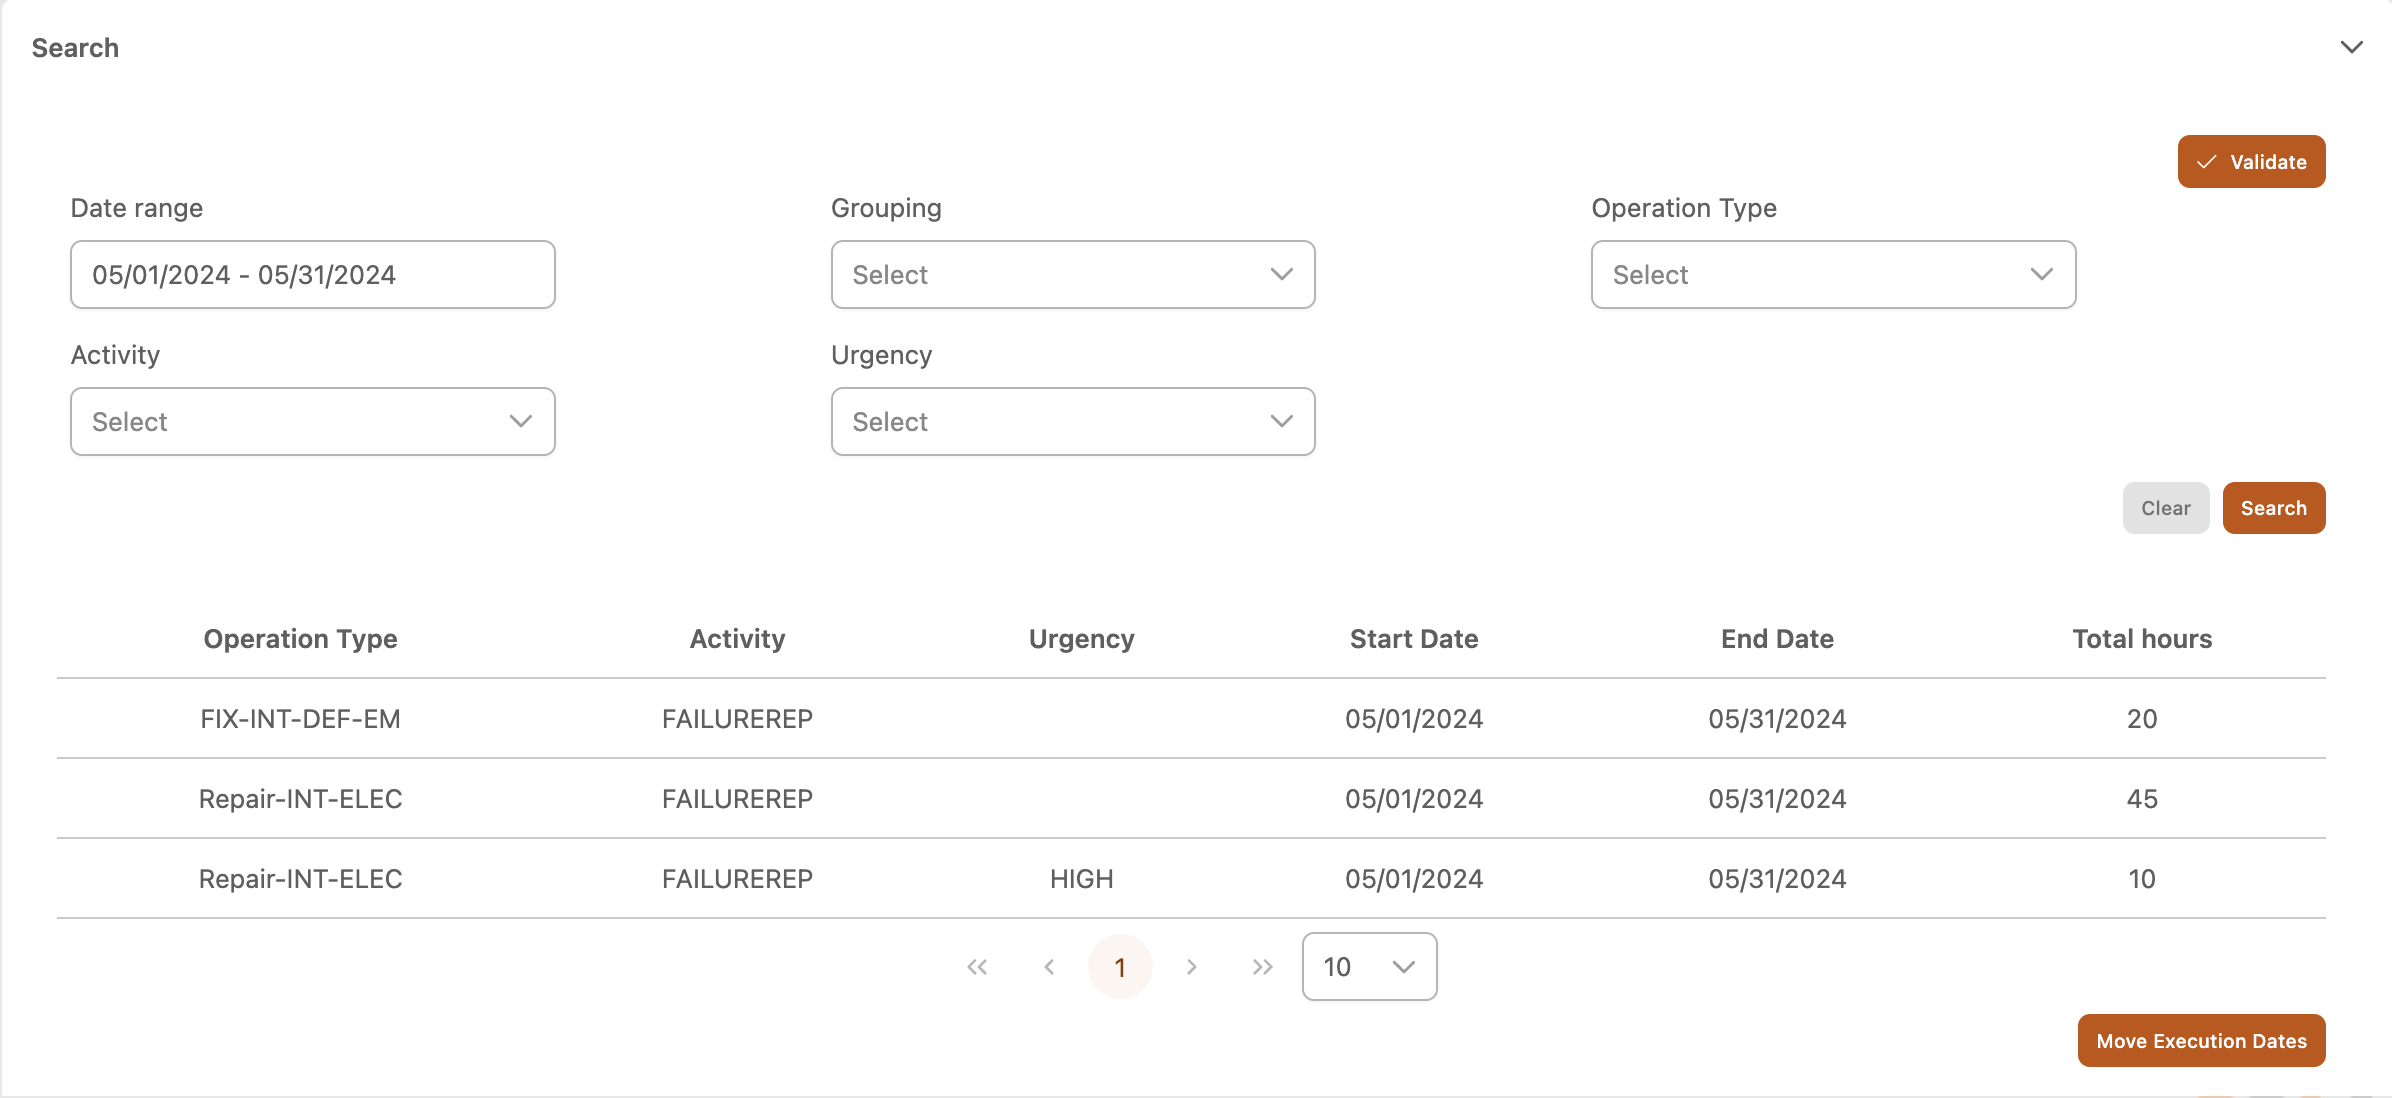
Figure 2 - View table result |
On the table, the user can:
-
Manually move execution dates, clicking the “Move execution dates” button. A new panel will allow to choose how much hours move and in which period, and after the confirm, the table will be updated and also the column chart.
-
Validate the new workload balancing, clicking the “Validate” button at the top-right of the table.