
The Activity Forecast feature allows you to simulate demand by configuring various types of tasks.
You can create forecasts based on either:
-
Real activities and operations already present in the system.
-
Simulated activities
Since a forecast is a simulation, the compare of more different forecasts help to better highlight differences between them.
A significant advantage of using activity forecasts is their complete independence from actual activities and work-orders data. This means any adjustments or edits made within the forecast simulation will not impact the live operational data in your system.
Before you start
-
Create at least two Activity Forecast
Compare Resource Forecast
-
In the FSM App, navigate to FEATURES → FORECASTING & CAPACITY PLANNING → ACTIVITY FORECAST
-
Use the filter panel to search for existing forecast records
-
Click the check button of max three Activity Forecasts
-
Click the “Compare” button on the top-right of the page
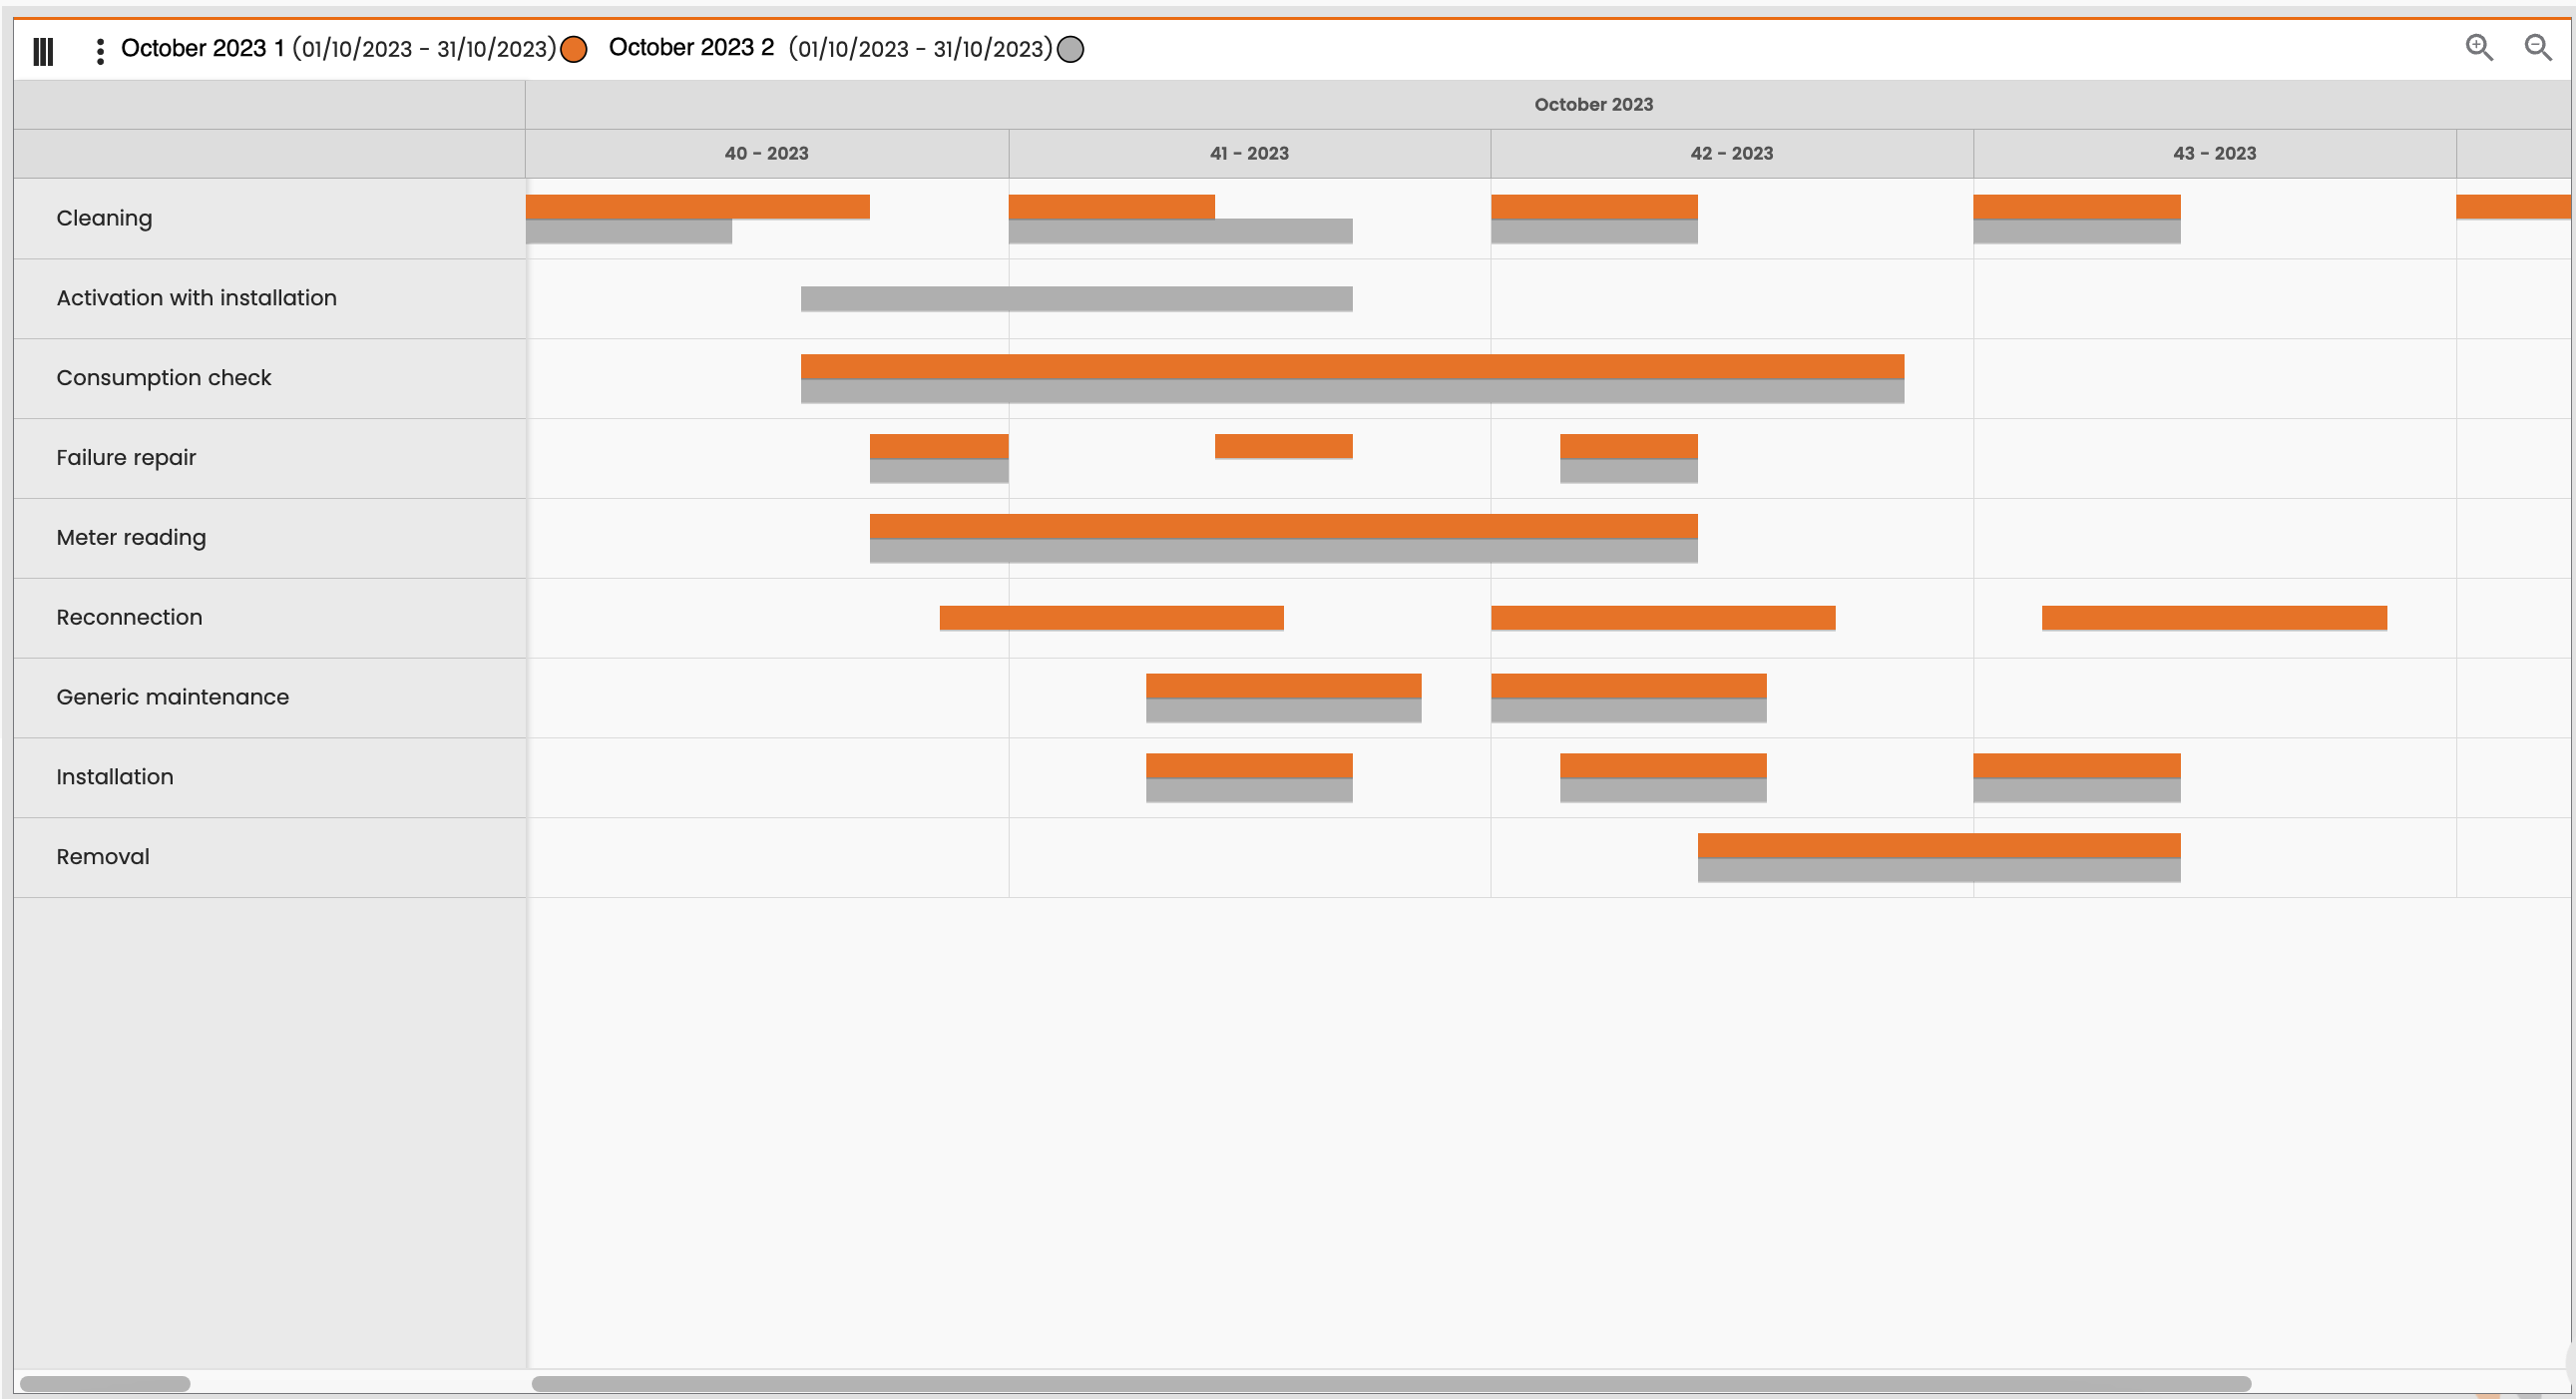
The compare page shows a gantt view, where each forecast is defined by a color (Figure 1 - Compare Gantt view).
|
|
Figure 1 - Compare Gantt view |
For each activity and for each forecast, there is a timeframe bar.
Example (Figure 1 - Compare Gantt view):
-
The activity “Reconnection” is defined only in the forecast “October 2023 1”
-
The activity “Cleaning” is defined in both forecasts, but in the first October’s week, the timeframe’s duration of “Demo Sprint 7 Bis” is shorter than that “October 2023 2”.