
The coverage scenario allows you to match activity forecasts and resource forecasts, and it is based on an optimized coverage algorithm, that optimizes the demand’s coverage and resources' usage.
The result is displayed on a reporting page, where the user can view the overall quality of the scenario, or explore it in detail by individual activities or months.
Before you start
-
Create the coverage scenario
View Coverage Scenario result
-
In the FSM App, navigate to FEATURES → FORECASTING & CAPACITY PLANNING → CAPACITY PLANNING
-
Use the filter panel to search for existing scenarios
-
Click the “View coverage” button in the menu button of a scenario. The coverage is available only on “Processed: OK” scenarios.
A new page will be opened showing coverage’s results.
Summary report
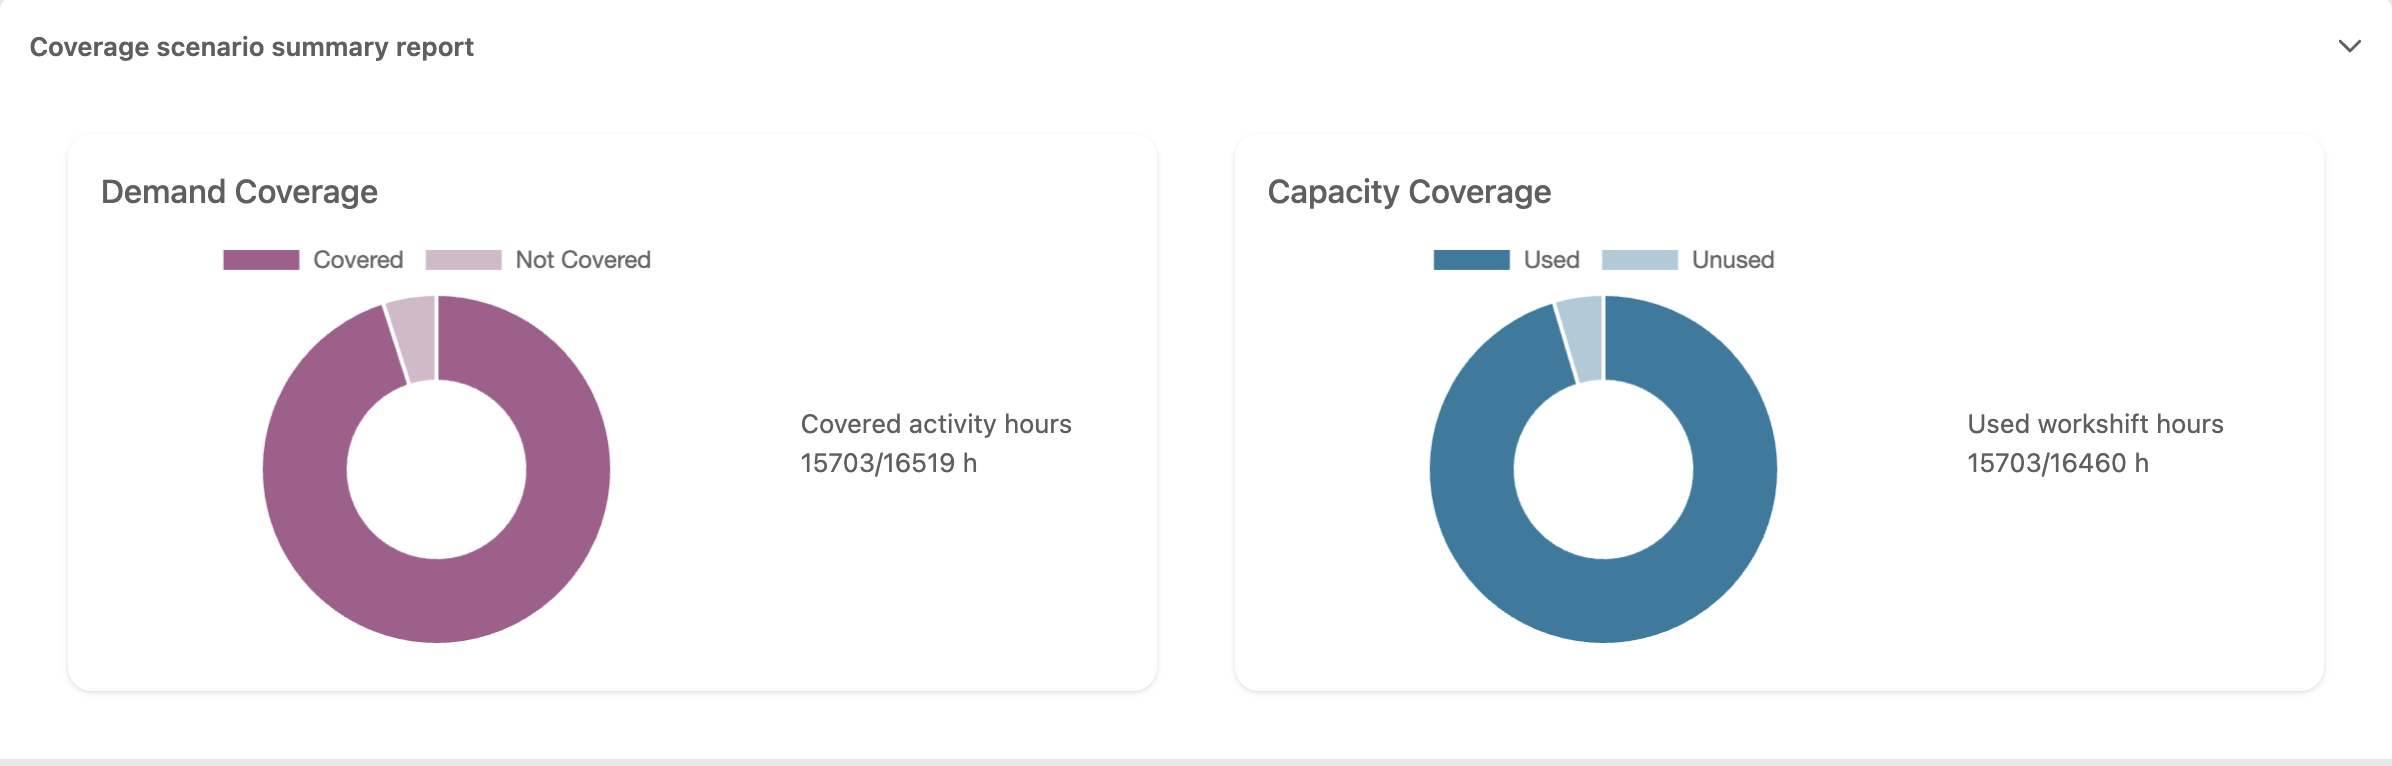
Summary reports provides a quick overview of how well the coverage scenario performed, both in terms of demand coverage and committed capacity.
The “Demand Coverage” section on the left displays a pie chart, where the orange segment shows the percentage of demand covered. Next to the chart, the actual number of hours covered is indicated.
The “Capacity Coverage” section on the right shows a pie chart, where the orange segment represents the percentage of capacity allocated to activities. Beside the chart, the actual number of committed hours out of the total available hours is displayed.
|
Assignment report
|
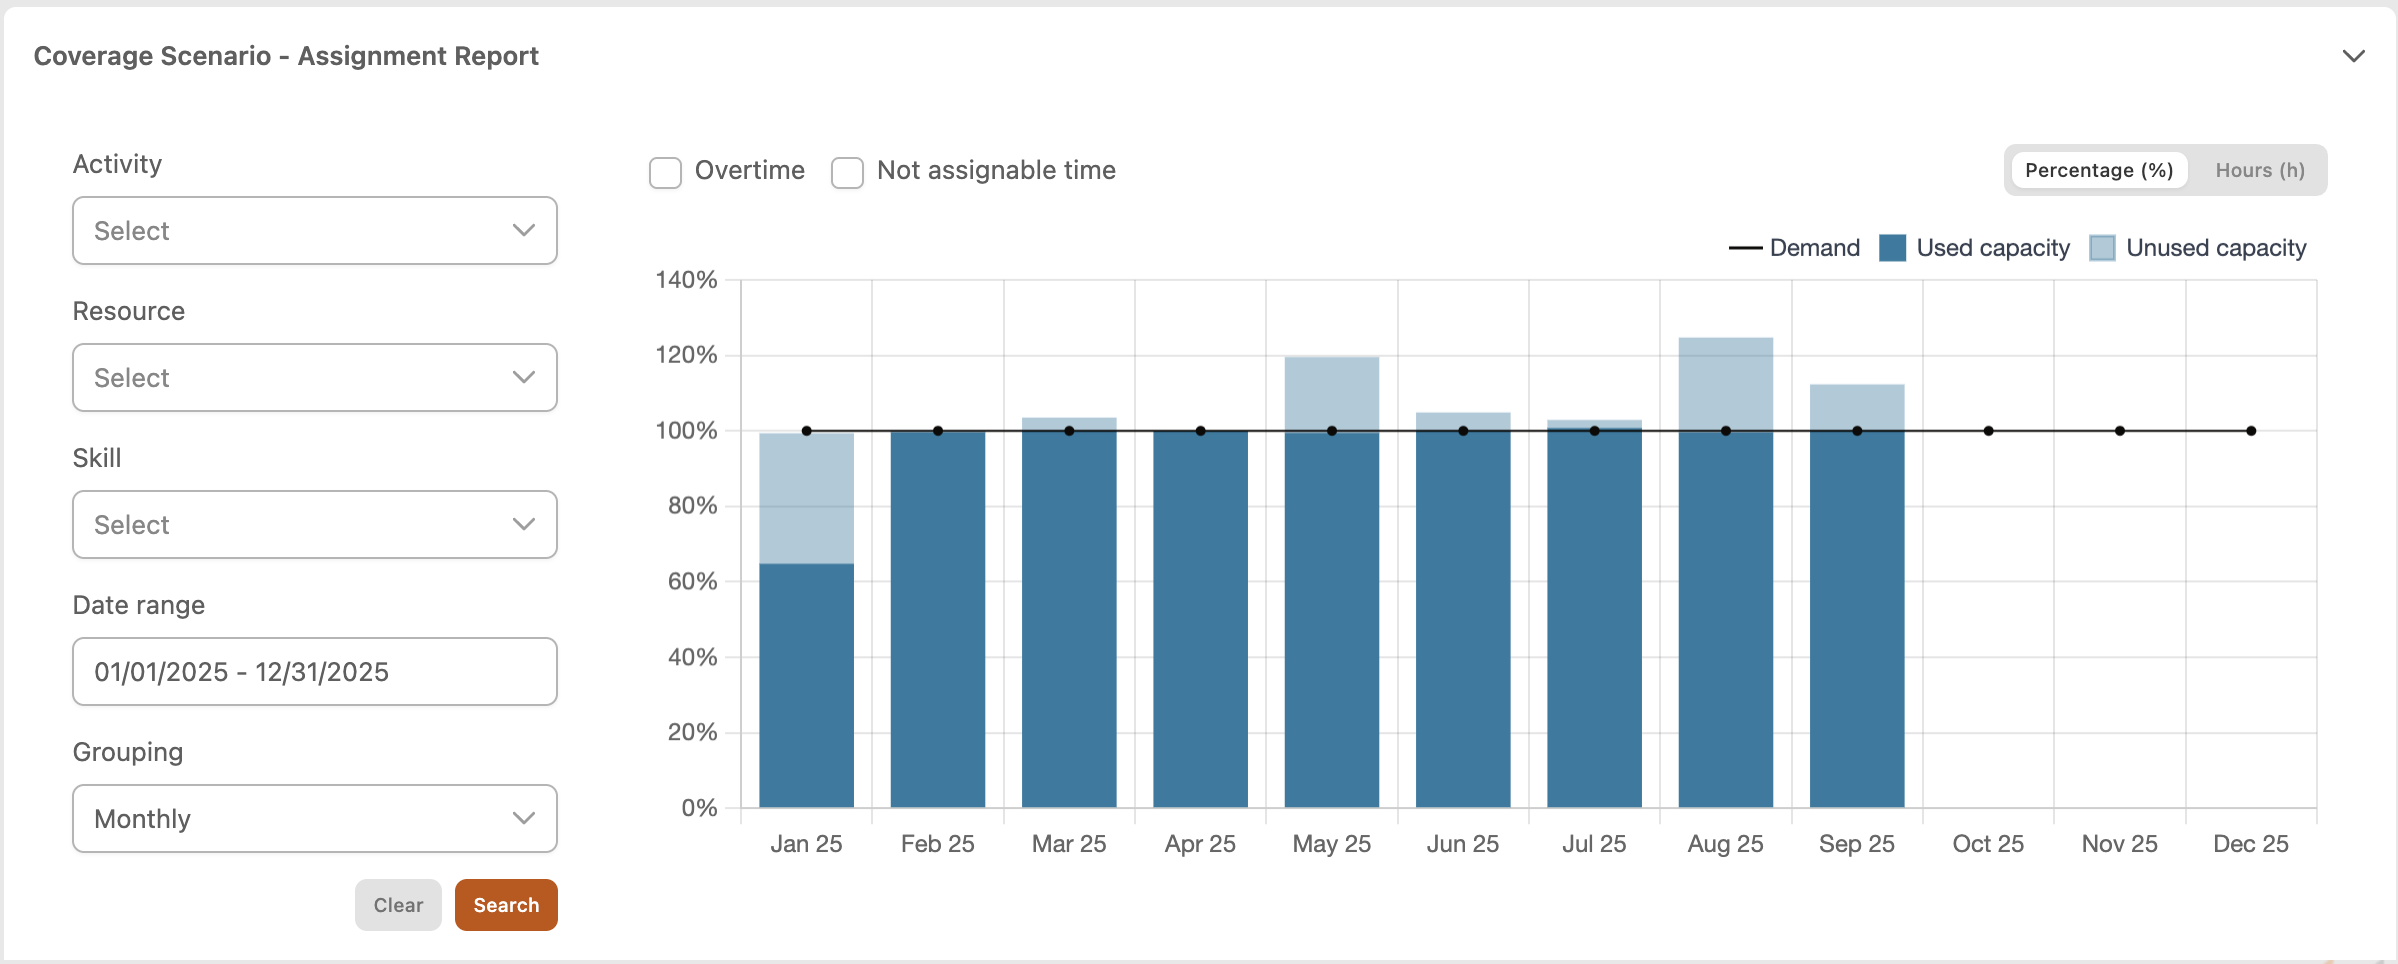
This report shows for each month (grouping can be daily, weekly or monthly) the amount of demand and capacity.
The y-axis represents the % of capacity related to the demand’s value.
The x-axis is the time and it depends by the grouping field.
The plot is also available in hours clicking on the “Hours” button at the top-right of the report.
Going on each bar you can see a tooltip with the total number of hours.
Demand
-
The black line is the demand and represents the 100%.
Capacity
-
The dark-blue bar is the committed capacity, that is the percentage value of total available capacity committed on some activities.
-
The light-blue bar is the committed capacity, that is the percentage value of total available capacity not committed on some activities. This data means that there aren’t enough resources with right skills to execute activities, or that there are many resources on leave or unavailable.
The plot can be filtered by Activity, Resource and Skill (multi-select), and Date range.
The grouping field allow to group by month, week or day, using these criteria:
-
Monthly: always available
-
Weekly: available only if the Date Range cover less than 6 months
-
Daily: available only if the Date Range cover less than 1 month
It is possibile to see how is composed the capacity time, selecting two checkbox fields:
-
“Overtime”: Split the “Committed capacity” in
-
Ordinary Time
-
Overtime
-
-
“Not assignable time”: Split the “Not committed capacity” in
-
Unavailable time: used for on leave time
-
Unusable time: used for training hours or other reasons
-
Table report
Clicking on each bar of the bar chart a table at the bottom of the page will show data related to the selected period.
The table can be filtered by date, activity, resource and skill (multi-select).
Each row of the shows the relation between each activity’s timeframe and the assigned resource:
-
Activity: activity code
-
Start Date: start date of timeframe
-
End Date: end date of timeframe
-
Expected Duration: expected duration of the timeframe
-
Resource Name: resource assigned to the timeframe
-
Resource Surname: resource assigned to the timeframe
-
Assigned Time: timeframe’s time assigned in ordinary time and overtime
-
Assigned Overtime: timeframe’s time assigned in overtime
-
Team: team’s number assigned to the timeframe
Related tasks