
Remember
When asking for help to the support group always provide:
-
IntegrationAPI check’s group:
-
IntegrationAPI url
-
Request’s HTTP method
-
Request’s timestamp
-
Request’s body (if applicable)
-
PrivateApi url (if present in response’s ProblemDetail)
-
Application Logs
-
-
PrivateAPI check’s group:
-
PrivateApi url
-
Error message
-
Reference use case (creating a workOrder, updating a resource, etc...)
-
Introduction
The Integration API project is responsible for orchestrating the various private APIs exposed by FSM: specifically, based on required use cases, integration APIs are exposed, which take care of calling the correct private APIs.
This guide aims to help the user identify the cause of the error and the group to ask for support.
Work Flow
Knowing the work flow is essential to contextualize and identify the problem more quickly:
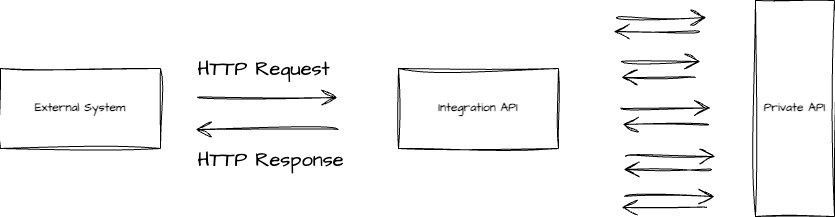
Once the External System performs the request, the IntegrationAPI layer, based on the request’s use case, performs one or more private calls to the PrivateAPI layer (whether these are decoding's GET to correctly populate the data of the record's CREATION or UPDATE requests, or simply extraction's GET of saved records) to finally respond again to the External System with a successful or an error response.
Private API layer is therefore responsible for carrying out CRUD operations on db data, while Integration API layer is just an orchestrator.
Must know
|
TraceId |
Unique identifier of the trace. It groups multiple events that belong together, so with the trace identifier we can retrieve all the calls made in the end-to-end flow of a user request (External System → Integration API → Private API and back) |
|
Problem detail |
Response in case of ERROR Therefore, in any case in which there is an error in the flow, be it an error found in the integrationAPI layer or in the Private API layer, the external system will receive a standard error body, the problem detail. |
Both, traceId and Problem detail, are essential to identify the error and report it to the relevant group.
Spot the ERROR
How to read the Problem Detail
Whenever the response to the call made by the External System is ERROR, the return body takes on the standard Problem Detail format, let's see an example in detail:
{
    "type": "about:blank",
    "title": "Internal Server Error",
    "status": 500,
    "detail": "Exception occurred reading PrivateApi response",
    "instance": "/integration-api-rest/api/integration/work-orders/r1/work-orders",
    "code": "IA000_004",
    "traceId": "ac414d470caec6dd889f9dba5797479d",
    "pvtApiErrorUrl": "/territory/locations/r1/addresses"
}
|
title |
HTTP status description |
|
status |
HTTP status code |
|
detail |
Error’s description |
|
instance |
Identifies the URL exposed by the Integration API layer invoked by the External System |
|
code |
Identifies the error code associated with the particular exception. All error codes are listed in the Error Codes Integration API page. |
|
traceId |
Unique identifier of the trace: with this identifier it’s possible to retrieve all the calls made in the end-to-end flow. |
|
pvtApiErrorUrl |
Identifies the PrivateAPI URL that is failing in the request flow |
Remember
The pvtApiErrorUrl field is inserted inside the problemDetail’s body if the exception inside the request’s flow actually depends on:
-
an exception that is thrown by a PrivateAPI Url
-
a validation of the PrivateAPI’s response on the IntegrationAPI side (this is exactly the case in the example above: the privateAPI responds with a successful HTTP code but is not correctly filling the response body; this causes a response validation exception on the IntegrationAPI side)
So, when you find the pvtApiErrorUrl valued you already know that generally check should be addressed to the PrivateAPIs' check’s group.
How to filter Logs
⚠️ TraceId is the log reading key!
-
Extract traceId identifier from the Problem Detail response
Remember
ProblemDetail is only returned in case of ERROR, if everything works correctly problem detail is not returned and, consequently, the traceId is not returned.
-
Access the system logs in the platform chosen for their collection
-
Filter logs using the traceId → in this way you will have the list of all the calls made in the entire workFlow triggered by the External System’s request
-
Look for logs with level ERROR
-
read error message and/or the stackTrace to better understand what is happening
-
What if I want to filter logs even if the response is SUCCESSFUL?
Although the purpose of this guide is to help troubleshoot in the event of an error, it is still intended to be a useful tool even in the simple case in which everything is working correctly but you still want to carry out an additional check on the logs.
A little while ago we said that the traceId is the key to reading the logs, however we also said that it is immediately available only if the return response to the External System is ERROR; so how to filter calls if SUCCESSFUL?
There are two fundamental parameters to use:
-
IntegrationAPI url that is called by the External System
-
Timestamp of the call → it is absolutely necessary to be sure of the time the call is performed to correctly identify the traceId
With these two informations you can easily filter logs to extract the traceId’s value which will uniquely connect all the calls associated with the first one made by the External System, so:
-
Access the system logs in the platform chosen for their collection
-
Filter logs using IntegrationAPI url and timestamp of the request
-
Extract the traceId from the filtered logs associated to this request
-
Filter logs again using traceId → in this way you’ll be able to extract all the call’s chain
Integration API or Private API error?
IntegrationAPI errors
When pvtApiErrorUrl is not valued in problemDetail’s body they are exceptions managed by the IntegrationAPI layer: generally, these cases identify errors during the input validation phase and the error message is sufficiently eloquent to immediately understand how to solve the problem.
Let’s see the examples below:
Constraint validation exception on input data
//Constraint validation exception
{
    "type": "about:blank",
    "title": "Bad Request",
    "status": 400,
    "detail": "externalSystemCode: must not be blank",
    "instance": "/integration-api-rest/api/integration/scheduling/manual/r1/scheduling/activities-assignments"
}
Logical validation exception on input data
//Logical validation exception
{
    "type": "about:blank",
    "title": "Bad Request",
    "status": 400,
    "detail": "Serial number SN000 repeated in more than one meter",
    "instance": "/integration-api-rest/api/integration/assets/r1/accounts",
    "code": "IA004_024",
    "traceId": "2997e29a9a5052d8f9b9887ef0d84260"
}
Generally, these are error cases managed in the IntegrationApi layer, which identify validation errors on fields that make up the request’s body.
1. Constraint validation exception → the error highlighted the fact that a NotNull field does not was actually valued ("externalSystemCode: must not be blank")
-
Logical validation exception → In this case the request foresees that there may be a list of Meters which must all have different serialNumber values, but a logical validation exception occurred because of the data consistency sent by the External System (more then one meter with same serialNumber)
Read the message carefully, generally these are well-explanatory messages that allow you to resolve the problem autonomously, otherwise do not hesitate to contact the IntegrationApi group if you believe that the ongoing logical validation is not what you expected for the use case you are testing.
PrivateAPI errors
Let's now look at another example:
Managed Errors thrown in privateApi layer
{
    "type": "about:blank",
    "title": "Not Found",
    "status": 404,
    "detail": "External system UNKNOWN_EXTERNAL_SYSTEM does not exist",
    "instance": "/integration-api-rest/api/integration/workforce/r1/resources",
    "code": "IA001_001",
    "traceId": "58f4206f53dba9a18051fa2737be3fc5",
    "pvtApiErrorUrl": "/configurations/system-settings/r1/external-systems"
}
When pvtApiErrorUrl is valued in problemDetail’s body they are exceptions managed by the PrivateAPI layer: these cases identify errors during the input decoding phase (GET requests to transform external code in internal id) or one of the other CRUD operations, as data insert or update.
In these case, since the IntegrationAPI layer is only responsible for orchestrating calls to the correct Private APIs and then reporting the overall response to the External System, check requests have to be forwarded to the PrivateAPI layer: ask for help in all those cases in which the return error message shows' something unexpected and not manageable independently (for example, an error that can be autonomous managed is the census of a new code that must be inserted in the specific decoding table).
Last but not least, let’s come back again to the first Problem Detail Example:
Not Managed Error caused by a PrivateAPI with a not compliant response
{
    "type": "about:blank",
    "title": "Internal Server Error",
    "status": 500,
    "detail": "Exception occurred reading PrivateApi response",
    "instance": "/integration-api-rest/api/integration/work-orders/r1/work-orders",
    "code": "IA000_004",
    "traceId": "ac414d470caec6dd889f9dba5797479d",
    "pvtApiErrorUrl": "/territory/locations/r1/addresses"
}
Private or Integration API error?
This is a special case:
-
code IA000_* → It's a special code that identifies errors handled in the IntegrationAPI layer
All Error Codes and their custom messages are registered here.
-
detail "Exception occurred reading PrivateApi response" → ⚠️ The particular Private API is responding with SUCCESSFUL but with an empty response body in a case in which a response body actually is mandatory, so an error occurs on Integration API's side.
-
pvtApiErrorUrl → Identifies the PrivateAPI URL that is failing in the request flow
Private API group has to be informed of this error because they are mistakenly responding with an unexpected body, but try to help them with all the possible context informations.
So what to do when you have to inform Private API group of an error occurred?
-
Access the system logs in the platform chosen for their collection
-
Filter logs using traceId
-
Look for the log with level ERROR
-
Extract the complete error message
-
Error message example: "HandleAPIException: Unexpected PrivateAPI response exception - Empty body returned [PrivateApi Url = /work-orders/r1/work-orders/unique-codes]"
-
-
give these information (PrivateAPI Url in error and error message) to the PrivateAPI group to help them find and fix as soon as possible the problem
-
Pay attention to details
Let’s see the example below:
Constraint validation error thrown in PrivateAPI layer
{
    "type": "about:blank",
    "title": "Bad Request",
    "status": 400,
    "detail": "description: must not be null",
    "instance": "/integration-api-rest/api/integration/workforce/r1/resources",
    "traceId": "de1236aa49fc5387e4dbfccecde09d09",
    "pvtApiErrorUrl": "/workforce/resources/r1/resources/{resourceId}/addresses"
}
As stated previously, the presence of the privateApiErrorUrl field filled in identifies an error occurred on the PrivateAPI side; the absence of the code field is identifiable as a case of request’s validation error on the PrivateAPI side.
This is a particular case in witch the exception is due to an error in the validation phase on the PrivateAPI side, caused by a request body (built and sent by IntegrationAPI based on the External Request) that did not have all the fields populated correctly -> in this case, if the message is sufficiently explanatory to understand independently which field should be added to the request, you can proceed independently, otherwise you can ask for help from the IntegrationAPI support group.
Particular cases
Let's consider a ProblemDetail that has a detail field like the following:
"detail": "Exception occurred reading PrivateApi response"
Sure the error detail message makes it clear that the exception occurred due to an unexpected PrivateAPI response but how can we actually understand what is happening?
First of all you need to go to the logs to see the full error message: so, as seen several times above, take the traceId in the ProblemDetail, use it to filter logs and look for the logged one with level ERROR and an error message that starts with the sentence "Exception occurred reading PrivateApi response" and is followed by a short but clear explanation.
This type of detail is returned in output in case of:
-
PrivateAPI Server unreachable → you can quickly check by simply try to access the swagger: the server may be unreachable due to a release in progress or some system problem; usually the problem is resolved without having to ask for support of any kind.
-
Unresolvable PrivateAPI basePath → this error occurs when you have not set correctly basePath due, for example, to a typo in the string (see Configuration guide for more details).
-
PrivateAPI response with an empty body (when expected) → this error case cannot be managed in any way independently, inform PrivateAPI check’s group.
Summary table
If you haven't done it at least once, read the guide, it is useful for understanding the context and makes it easier to identify the error; If you've already read it and just need a quick summary, read here:
|
Error Type |
Cause |
Check’s group |
Is actually necessary to ask for help? |
|---|---|---|---|
|
pvtApiErrorUrl is not valued |
IntegrationAPI |
The error’s detail is well explanatory and allows you to quickly resolve it independently, just fix the input: ask for support only if you believe that the validation is not suitable for the use case you are testing. |
|
|
pvtApiErrorUrl is not valued |
IntegrationAPI |
The error’s detail is well explanatory and allows you to quickly resolve it independently, just fix the input: ask for support only if you believe that the validation is not suitable for the use case you are testing. |
|
|
pvtApiErrorUrl is valued |
PrivateApi |
In many cases these are errors managed due to missing data in the configuration tables or values that are not compliant with the intended use case: contact the support team only if you cannot fix the problem yourself, for example by calling the specific privateApi of census of new records in the configuration tables or by arranging the request data in a consistent manner with what is indicated in the error message. |
|
|
pvtApiErrorUrl is valued |
PrivateApi or check your own configurations |
Only if the full error message extracted in the logs is Unexpected PrivateAPI response exception - Empty body returned notify the PrivateAPIs' support group by providing all the useful informations, this error case cannot be managed in any way independently.
If the full error is: Unexpected PrivateAPI response exception - Unresolvable basePath check your configurations and be sure to have the basePath property set correctly.
If the full error is: Unexpected PrivateAPI response exception - Server unreachable first of all check if server is actually unreachable by simply access the privateAPIs’ swagger, if yes wait until the server become reachable again; if no, so the server is reachable, check in your configurations if PrivateAPI’s basePath starts with https. See Particular Cases. |
|
|
pvtApiErrorUrl is valued but code field is not present |
IntegrationAPI |
This is a particular case in witch the exception is due to an error in the validation phase on the PrivateAPI side, caused by a request body that did not have all the fields populated correctly. The request body is built and sent by IntegrationAPI based on the External Request, so it is important to understand if there is a missing constraint on the IntegrationAPI side or if the External System has not composed the request correctly based on the use case. |
Appendix
1. Dynatrace is your log's collector?
Let's see together how to recover logs in Dynatrace through a short step by step photographic guide:
-
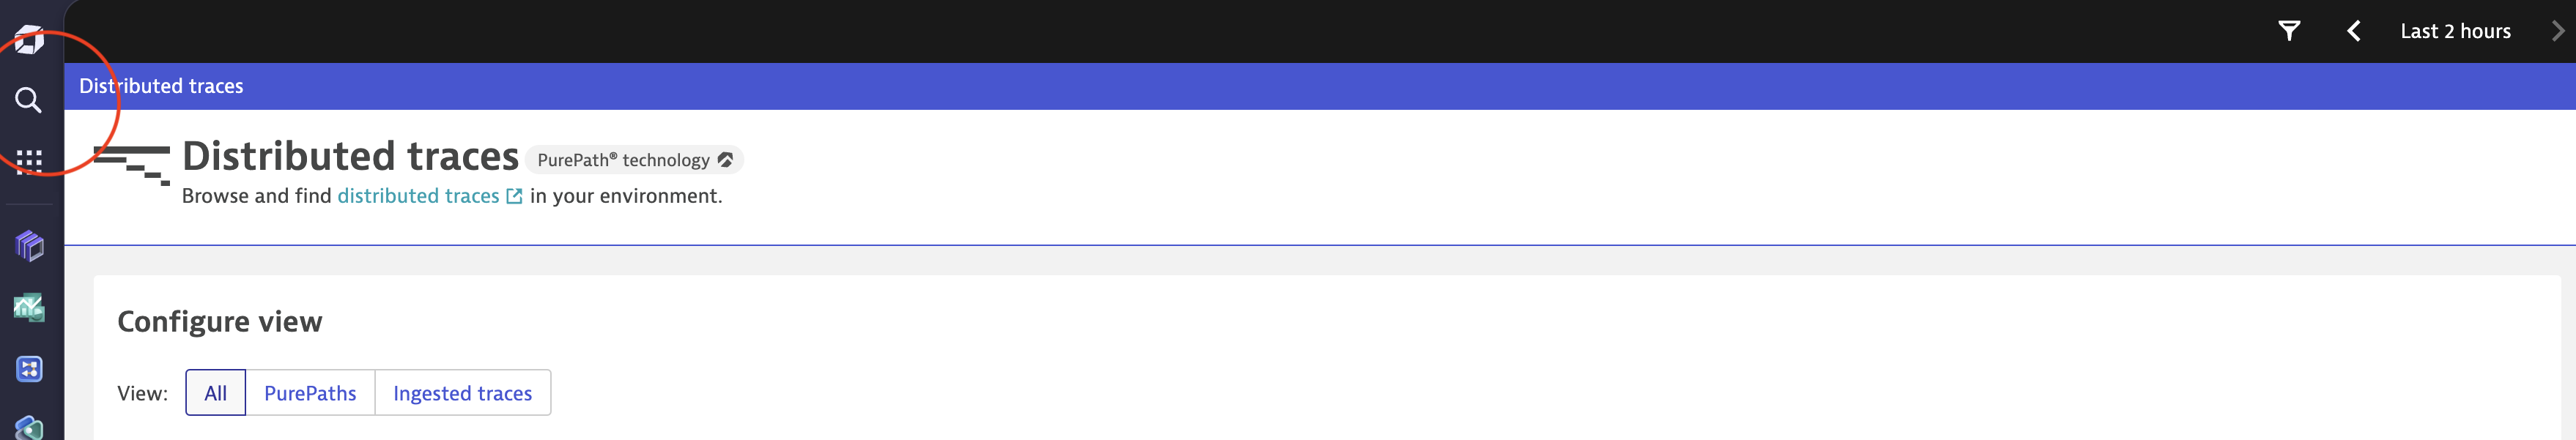
Go to Dynatrace link.
-
Click on the magnifying glass on the left:
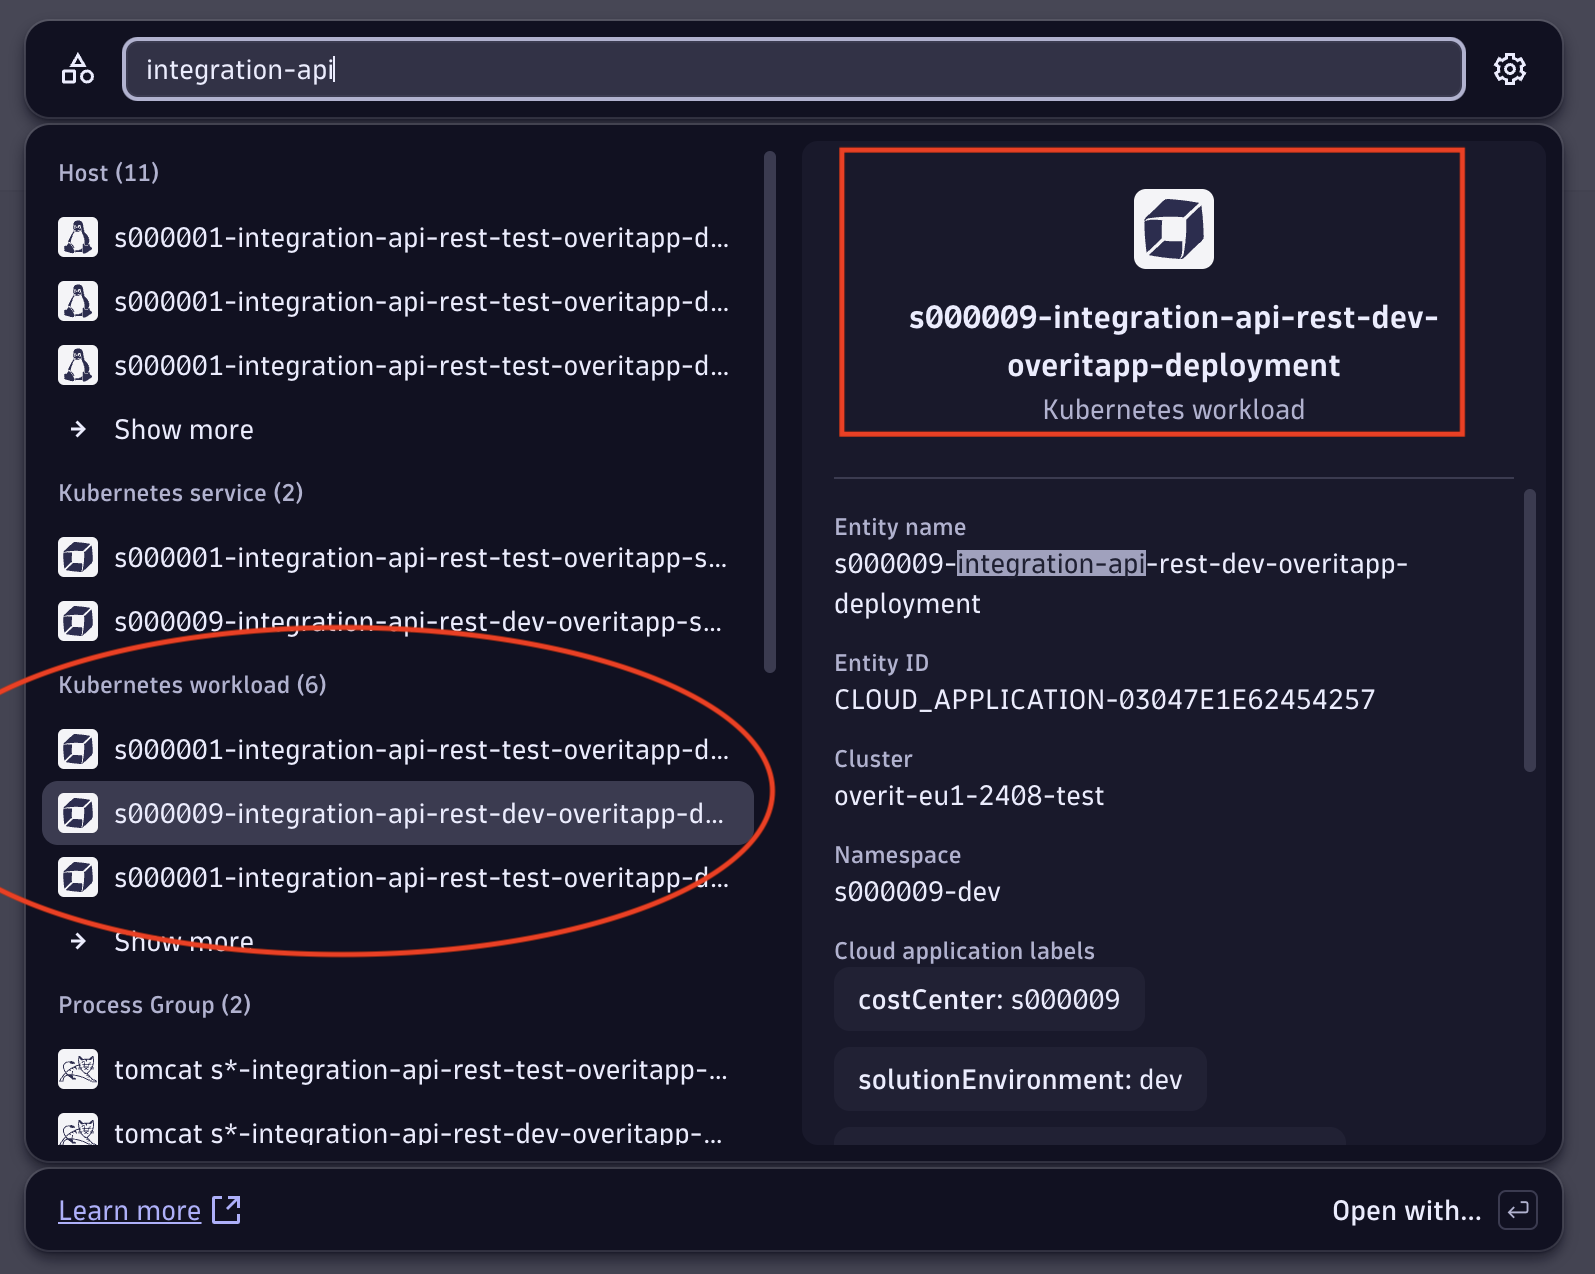
-
A popup will appear where you can write “integration-api” in the search bar and, under the list of Kubernetes workloads, click on the correct *overitapp-deployment based on the environment in which you are testing (in the example below the environment is DEV):
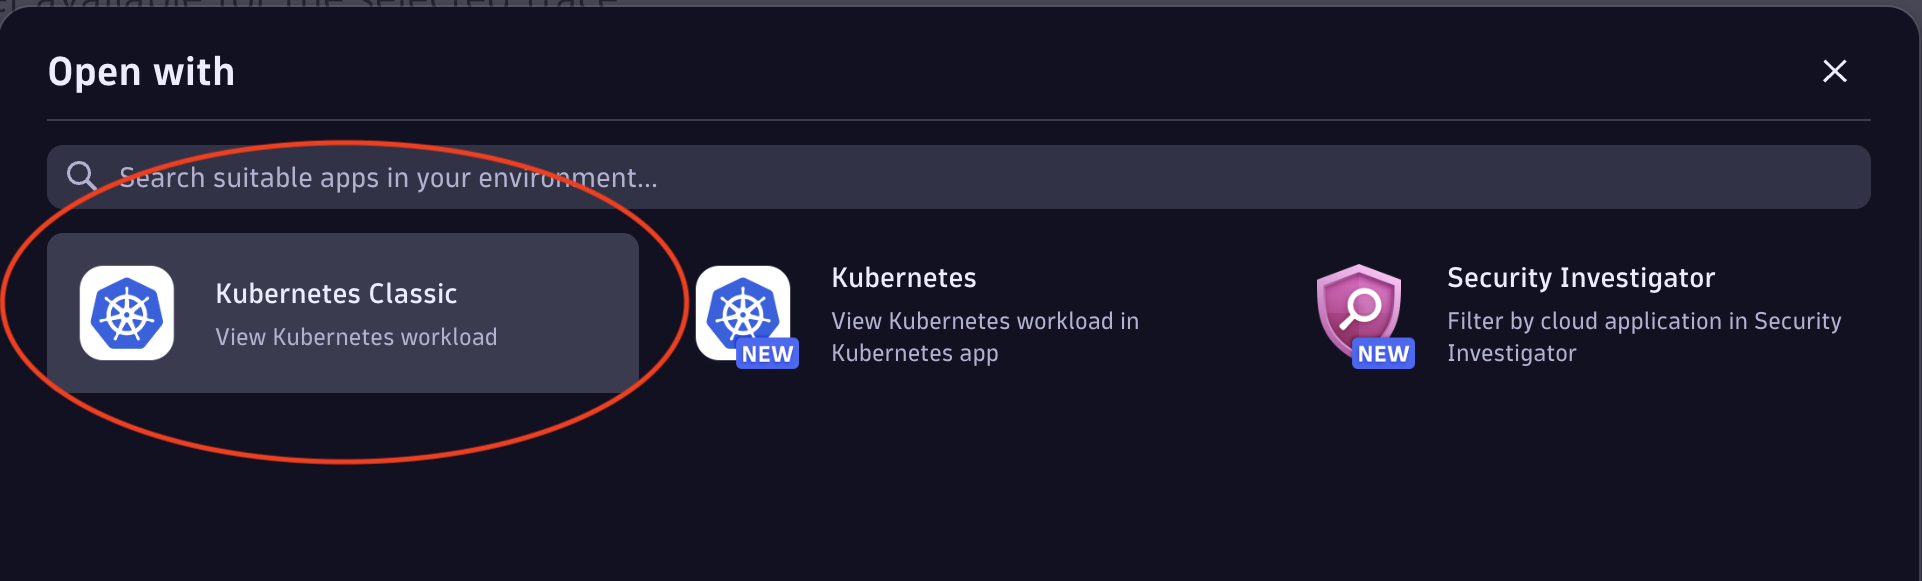
-
Choose the view in the next pop up:
-
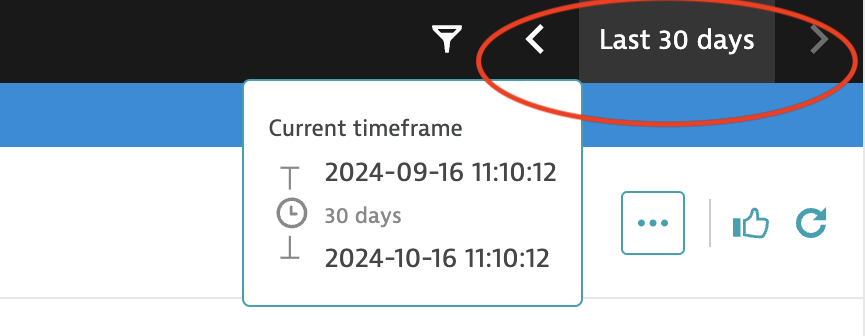
On the page that opens, be careful to filter the time range for which you want to see the logs (top right):
-
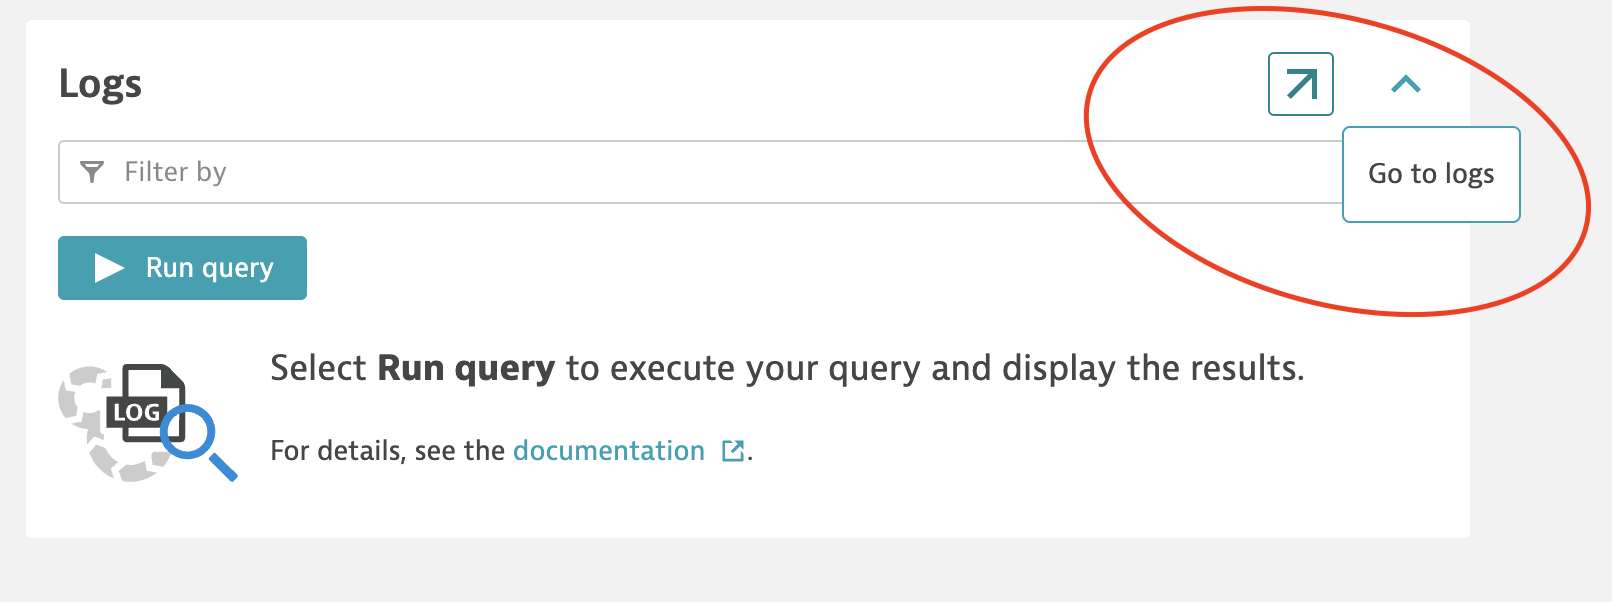
Scroll the page until you find Logs at the bottom right and click the arrow to be redirected to the log page, where there will be a first active filter with the time range previously chosen:
-
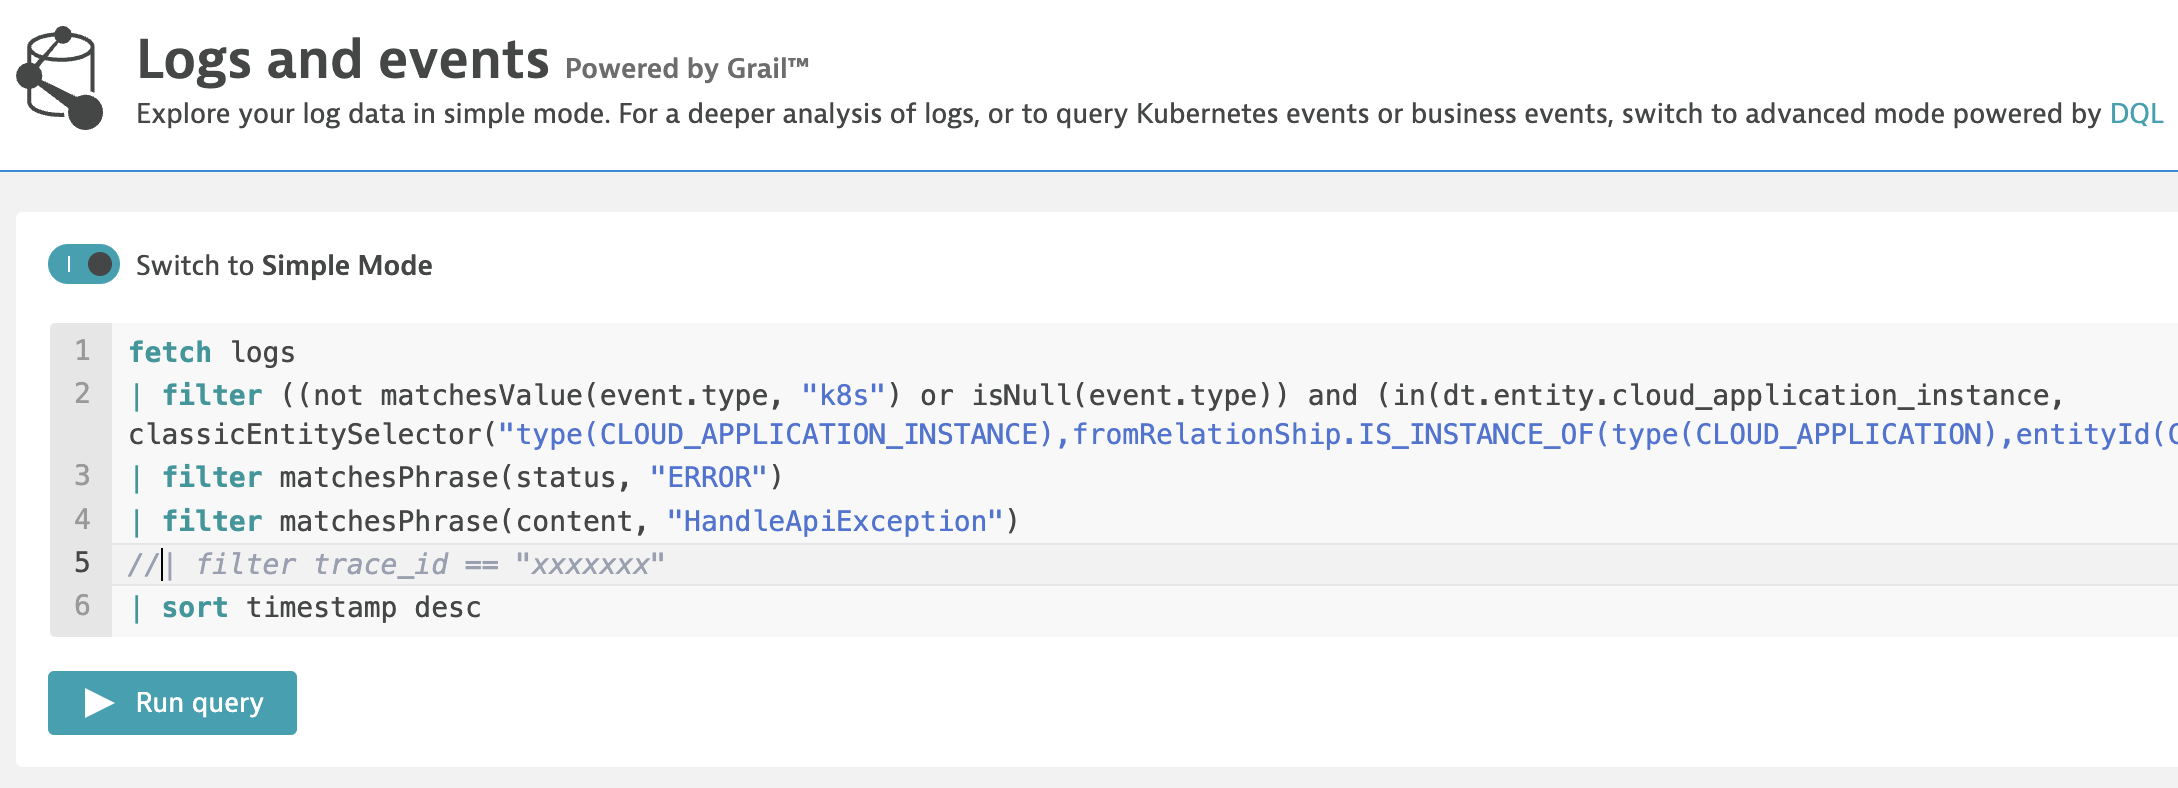
In the page you have been redirect, run the query by clicking on the run query button to view the logs filtered only for the timestamp chosen in point 4 (you can always change this timestamp, because this filter is always visible in all these pages).
At this point, you can help yourself with other search filters, for example:
-
Do you have traceId? Add it to filters (the line commented in the image below)
-
You don’t have traceId and you need to retrieve it? Add both the following filters
-
| filter matchesPhrase(status, "ERROR")
-
| filter matchesPhrase(content, "HandleApiException")
-
With these two filters and with the correct timestamp it will be easy to find out the exception occurred.
-
Once you have applied all the necessary filters you will have a log lines list (or just one): clicking on the specific line will open a detailed pop-up from which it will be possible to obtain all the useful information. For example, in the image below, scrolling to the bottom of the popup, you will find the transaction’s traceId and, by clicking on it, a detail will open that will allow you to copy the value or add it directly as a filter in the log’s search query.
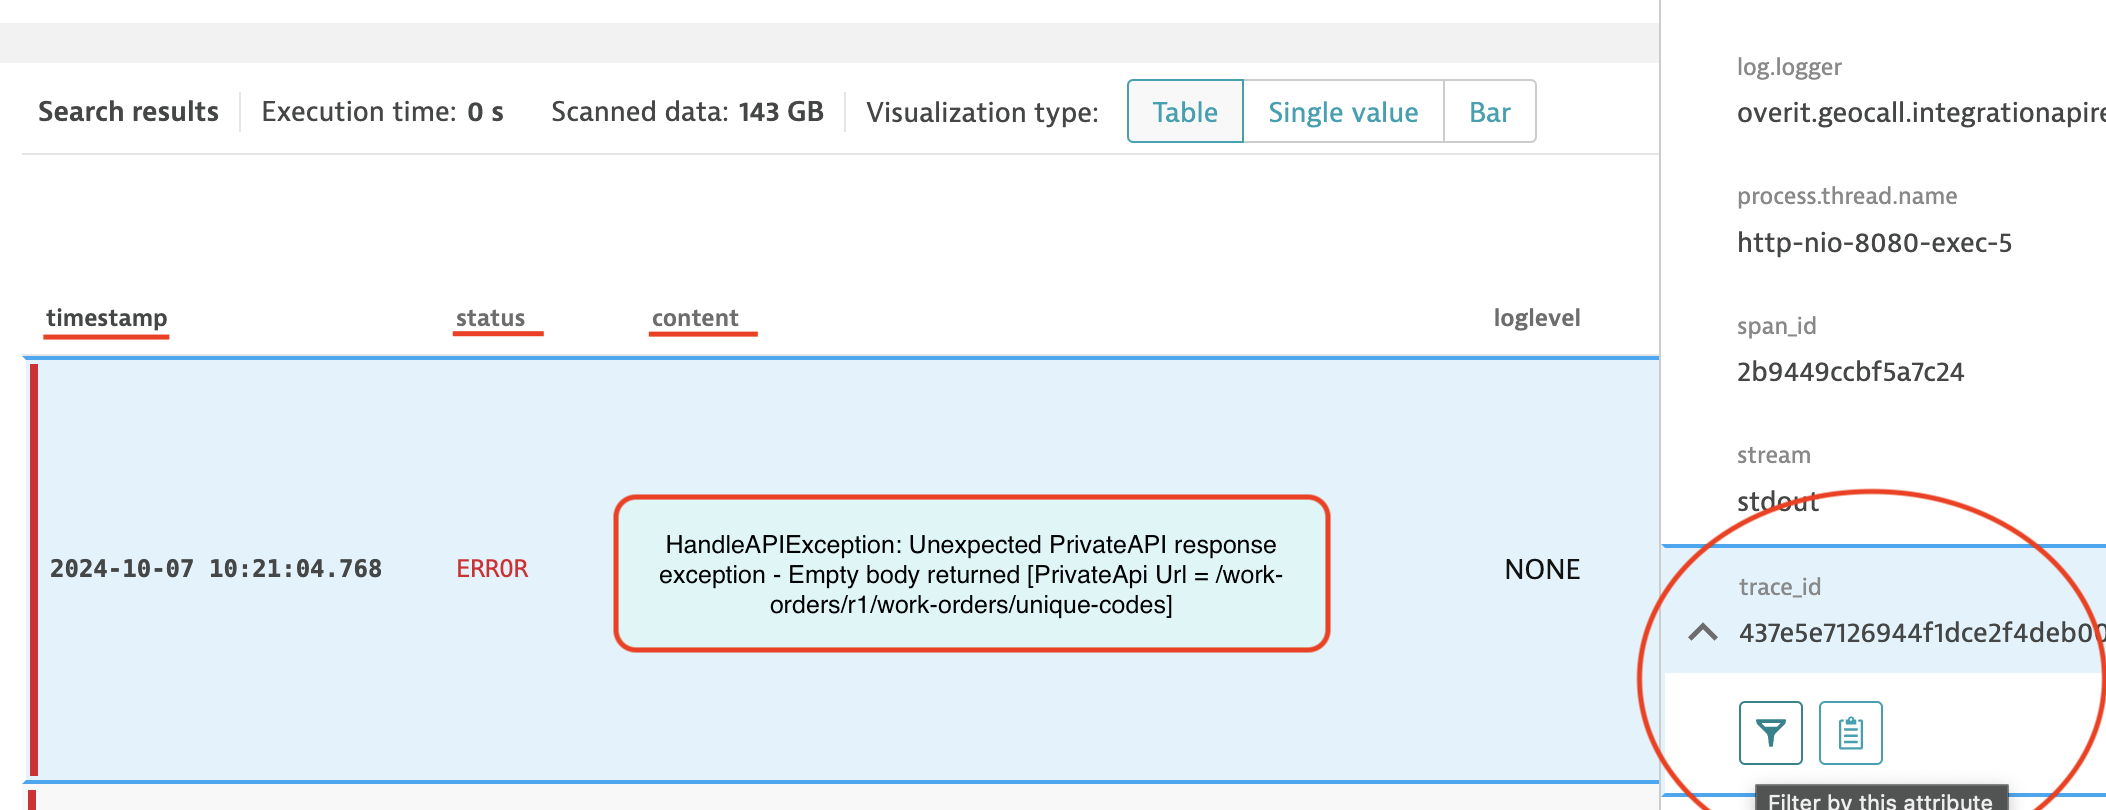
Although the image above is just an example, remember the details to pay attention to:
-
timestamp for the temporal correlation with the error;
-
status to establish whether it is actually ERROR or INFO type information;
-
content which contains log message and which already tries to be as explanatory as possible;
-
finally, by clicking on the log line, in the detail popup that will open on the right, in addition to the stackTrace and other useful information, at the bottom, you will find the traceId, which is essential for finding all calls associated with the External System’s request.
⚠️ If you want to filter logs by traceId, be careful to comment (just add // at the beginning of the line) the two filter lines, if they have actually been inserted, indicated at point 7, otherwise the entire chain of calls will not come out but only the log line associated with the error.